- * Possibilité de déplacer la carte avec la souris (+Ctrl).
- - Note : cette première version n'est pas vraiment optimisée. Les mouvements sont saccadés si le fichiers grib est trop grand ou si la machine est trop lente. Dans ce cas, les flèches permettent toujours de se déplacer par petits sauts.
- Rappel : un clic avec le bouton du milieu amène le point visé au centre de la fenêtre.
- - la fenêtre principale reste active et on peut ouvrir d'autres courbes.
- l'affichage des rafales est en mode ligne (plus lisible).
- l'affichage des températures est correct même si le grib ne contient pas les températures min/max.
- la courbe de déviation du vent n'interfère plus avec la pression et la nébulosité.
- - Les vent en dessous de 40 kts sont ignorés et l'échelle monte jusqu'à 240 kts.
- Passage des couleurs normales aux couleurs des jet streams par 'Ctrl+Maj+J'
ou par le menu 'Carte météo'->'Options'.
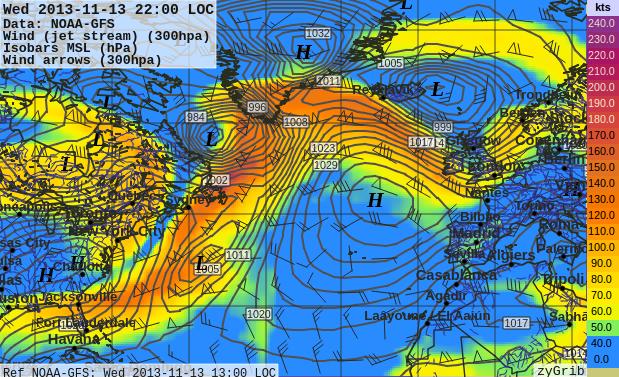
- Exemple : vent au dessus de l'Atlantique à une altitude de 300 hPa- 1. Image classique : saturation dès 75 kts de vent : wind 300 hPa
2. Nouvelle échelle de couleurs : la position précise du courant jet est visible : jet stream 300 hPa
- 1. Image classique : saturation dès 75 kts de vent : wind 300 hPa
* Pseudo bug corrigé : une version stable de la librairie qwt est installée avec les fichiers source, car elle n'est pas compatible avec elle-même d'une version à l'autre. - - Note : cette première version n'est pas vraiment optimisée. Les mouvements sont saccadés si le fichiers grib est trop grand ou si la machine est trop lente. Dans ce cas, les flèches permettent toujours de se déplacer par petits sauts.

- * Map scrolling with the mouse (+Ctrl).
- - Note :this first version is not really optimized. The movements are jerky if the grib file is too large or if the machine is too slow.
- Reminder: click with the middle button to move the target point to the center of the window.
- - the main window remains active, other curves can be opened.
- wind gust display with lines.
- temperature display is correct even if the grib does not contain the min/max temperatures.
- deflection curve of the wind no longer interferes with the pressure and cloudiness.
- - the wind below 40 kts is ignored and the scale goes up to 240 kts.
- Use key combination 'Ctrl+Maj+J' to toggle between jet stream colormap and the standard one, or navigate in the menu 'Weather map'->'Options'.
- Example: wind over the Atlantic at an altitude of 300 hPa- 1. Classic image: the colors are saturated above a wind speed of 75 kts: wind 300 hPa
2. New colormap: the exact position of the jet stream is visible: jet stream 300 hPa
- 1. Classic image: the colors are saturated above a wind speed of 75 kts: wind 300 hPa
* Pseudo bug fixed: a stable version of the qwt library is installed with source files, because it is not compatible with itself from one version to another. - - Note :this first version is not really optimized. The movements are jerky if the grib file is too large or if the machine is too slow.
- Image 1 (classic colors)
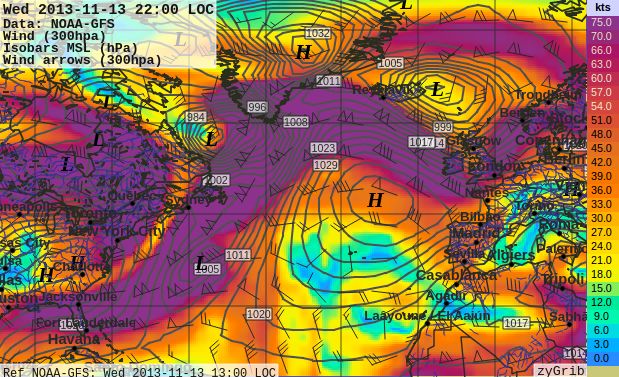
Image 2 (jet stream colors)